

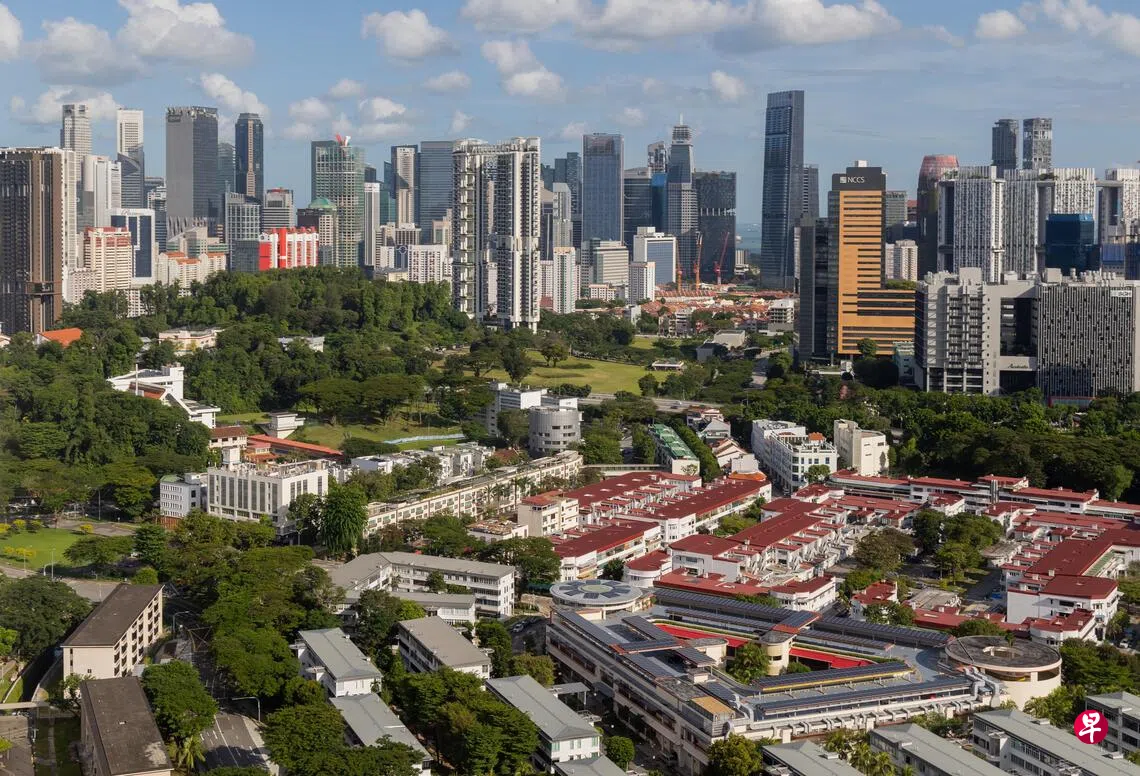
Planning areas with the highest proportions of university graduates and high-income households are mostly in central Singapore. Downtown Core led the country last year, with its Median Monthly Household Market Income per Household Member reaching $13,396.
In an article titled “Geographic Profiling of Singapore’s Resident Population” (《新加坡居民人口地理空间分析》) published on Wednesday (28 October), the Singapore Department of Statistics said residents’ overall educational attainment improved between 2015 and 2025, with the proportion of university graduates rising in most planning areas.
In 2025, all of the top 10 planning areas by proportion of university graduates were in central Singapore, except Clementi. Tanglin topped the list at 83.6%, followed by River Valley (81.1%), Newton (76.6%), Downtown Core (73.7%) and Bukit Timah (71%).
Clementi and Queenstown, which were outside the top 10 in 2015, ranked ninth and tenth in 2025 at 45.3% and 44.4% respectively, replacing Punggol and Serangoon.
Planning areas with higher proportions of university graduates generally also had higher household incomes. The Singapore Department of Statistics said household market income had generally increased across planning areas over the past decade, but the highest-income areas remained concentrated in central Singapore. Market income is defined as household income before taxes and government transfers, including income from employment and non-employment sources such as investment returns.
In 2025, Downtown Core’s median monthly household market income per household member reached $13,396, overtaking Tanglin, which held the top spot in 2015. Newton and River Valley ranked second and third at $12,222 and $9,923 respectively. Tanglin’s median monthly household market income per household member was $9,707 in 2015.
The proportion of high-income households in Downtown Core also rose significantly. In 2025, 68% of households in the area had a monthly household market income per household member of at least $10,000 — the highest proportion nationwide and well above the 41.9% recorded in 2015. Newton and River Valley ranked second and third nationally at 64.4% and 48% respectively.
However, Downtown Core still had a proportion of low-income households. In 2025, 22.8% of households in the area had a monthly household market income per household member below $2,000, little changed from 21.2% in 2015.
